Start a scientific paper by finding what question the researchers asked. Use the abstract to decide whether the paper belongs in your reading pile, then go to the methods, results and figures to see what the researchers actually did and found. Before you write a summary, check how far those findings can reasonably go.
You can read different parts in a different order from the way they appear on the page. If a result matters, go back to the method used to obtain it. If the discussion makes a broad claim, find the result it relies on. The process gets easier when you have a question to answer each time you turn back.
Decide why you are reading this paper
#The way you read for a class discussion is different from the way you check a sentence in an essay. For a discussion, you may want the main question, one result and something worth asking about. If you need to cite a precise claim, you need enough detail to understand the study design, the measure used and the limitations that affect that claim.
Write down your purpose in a sentence. For example, “I want to find out how the authors measured whether the seedlings grew faster.” That is easier to use than “understand the whole paper.” It points you to a specific measure in the methods and a figure or table in the results. You can come back for the rest when your assignment requires it.
Check the type of article before hunting for sections. An empirical study reports observations, measurements or other evidence gathered and analysed by the researchers. A review pulls together existing research and may have its own explicit method for deciding which studies to include. An editorial or commentary typically makes an argument or interprets work from elsewhere. A preprint may also differ from a later peer-reviewed publication. Read the version and publication details displayed by the source.
Use the abstract to choose what to read next
#The abstract is a short tour of the paper. Use it to find the topic, the people or materials studied, what was measured and the main result the authors chose to highlight. Circle an important term that you cannot explain. Put a question mark by any phrase that sounds broad, such as “improves performance,” when you have yet to see how performance was measured.
Then move to the end of the introduction to look for the specific question, objective or prediction. The first part of the introduction often describes earlier work and why the field cares. That context helps later. On your first pass, the important thing is to locate the gap this paper wanted to address and the outcome it planned to examine.
If the abstract says the study is about growth in young plants, look for the plant species, the growing conditions and what “growth” means in the paper. It could mean height, leaf area or mass. Those are different answers. The abstract gives you the lead. The paper gives you the detail you need to use it.
If you only have access to the abstract, look for the full article through your library, the publisher or an author manuscript in a trusted repository. Note which version you read. When full text remains unavailable, phrase your own work within what you can substantiate or select a source you can examine. A missing methods section leaves important questions unanswered.
Read the methods with the result in mind
#Find what was actually measured, who or what was included, and how the researchers made their comparisons. On a first pass, you can leave an unfamiliar instrument name for later. Spend the time on details that could change your interpretation.
| What to look for | A useful question to write beside it |
|---|---|
| Sample | Which people, places, objects or time periods are represented? |
| Assignment or selection | How did observations or participants end up in each group? |
| Comparison | What is the reference group or condition? |
| Measurement | What did the researchers measure and in which units? |
| Timing | When and how often was the measurement taken? |
| Missing observations | Did some measurements or participants drop out before the result was calculated? |
In an experiment, check what was changed and which other conditions the researchers tried to keep similar. In an observational study, look for what the authors could observe and the other differences that may matter. For qualitative work, the questions may be about who was interviewed, how the material was analysed and what kinds of views the sample can represent. The article type guides the check.
Sample size has a practical meaning beyond the number printed in a caption. Imagine a team measuring the same plant five times during the week. Five readings from that plant give information about change across the week. They still come from one plant. Check how the paper defines a participant, sample or observation before interpreting totals.
Pay attention to what the study left out. If it enrolled people from one class or used seedlings of one variety, those boundaries belong in your notes. A clear boundary is a useful piece of information. It keeps you from quietly rewriting a finding from one class as a result for every learner.
Read a figure from its labels inwards
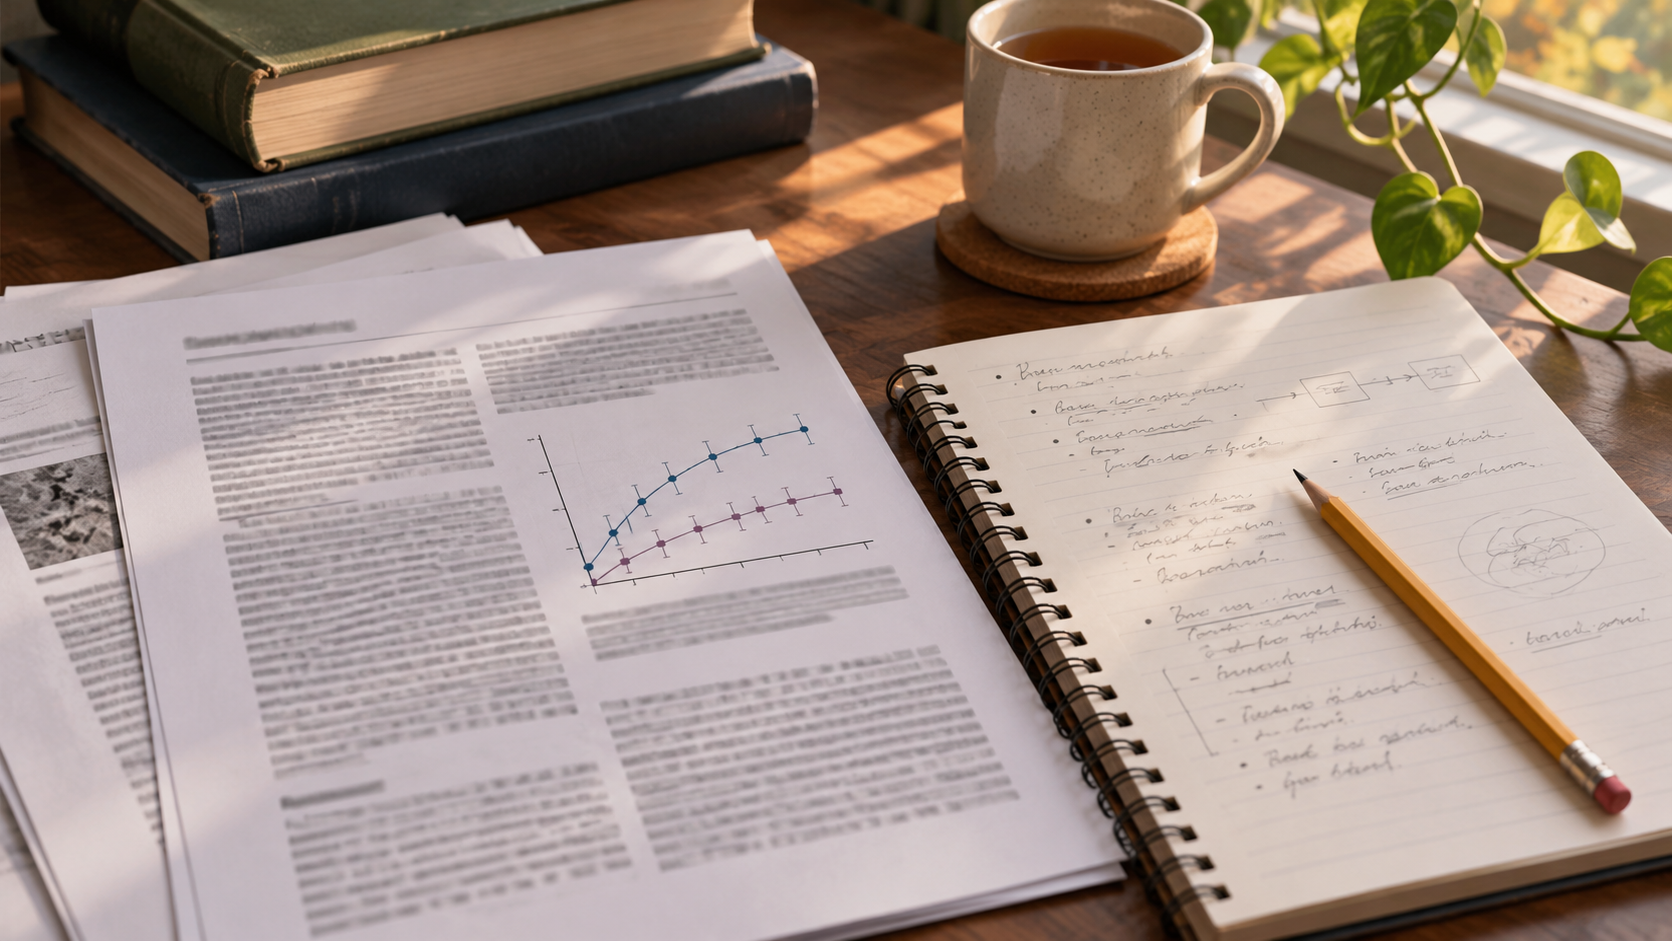
#Start with the caption, then the axes and legend. Find the units, the time period and the groups. Check whether the graph shows individual measurements, averages or something else. If there are error bars or shaded bands, use the caption and methods to learn what they represent. Different charts use them for different things.
Look at the scale before judging the size of a difference. A vertical axis that starts close to the plotted values can make a modest gap look large. Read the values and work out the size of the gap in the original units. That also gives you a concrete number to check if the sentence next to the figure describes the outcome another way.
A drawing or photograph in a figure may show an example rather than the entire set of observations. Look for the sample count and the analysis behind the claim. In a multi-panel figure, identify the letter of the panel you need. A note that says “figure 2B shows leaf count after 21 days” is much easier to retrace than “the figure showed growth.”
Read the matching results paragraph. It can tell you which comparison the researchers actually ran and what they could say about uncertainty. A statistical result does not tell you on its own whether a difference is useful in practice. The size of the difference, the units, the uncertainty and the question you set out to answer all matter.
Work through one fictional example from start to finish
#Imagine a classroom project looking at whether young bean plants grow taller under two lamp schedules. This is an invented example to practise the reading method. The numbers do not describe a real experiment.
In the introduction, the question is whether a longer daily period under a lamp changes seedling height over three weeks. In the methods, 24 pots are split between two shelves. One shelf gets eight hours of light each day and the other gets 12. Each pot contains one seedling of the same variety. Students measure the height from the soil line at the end of the third week. They say they tried to water the pots on the same schedule.
A fictional figure shows average height of 11 centimetres on the eight-hour shelf and 13 centimetres on the 12-hour shelf. The caption identifies 12 pots on each shelf. The observed difference is two centimetres. The figure does not show the height of each plant or an estimate of uncertainty. You can state the group averages. You cannot tell from that figure how much the individual heights overlap.
There is another detail worth checking in the methods. All the plants receiving the longer schedule were on one shelf. If shelf temperature or lamp position differed, those conditions could contribute to the gap. There are 24 plants, but the team used only one shelf for each schedule. A follow-up using multiple comparable shelves per condition would help separate the schedule from the shelf.
A careful summary would say that the plants on the 12-hour shelf were taller on average under the conditions of the classroom exercise. It would name the two-centimetre gap, the measurement time and the shelf limitation. A headline claiming that four more hours of light always makes beans grow two centimetres taller goes beyond those observations. If the authors were interested in crop yield, the height result alone would leave that question open as well.
Keep the discussion and the finding in different lines
#The discussion gives the authors' explanation of their results, how the results fit earlier work and what they think should happen next. That is useful context. It may contain a plausible mechanism that the researchers did not measure directly. Give the observation and the explanation separate lines in your notes.
For the plant example, the finding would be the difference in average height. A possible explanation could involve time under the lamps. A competing explanation could be a difference between shelves. A next study could test that. By keeping those pieces apart you can explain the paper accurately without having to decide that every proposed explanation is settled.
Check the limitations the authors identify. Then check the methods and results for any limitation that matters to your own use of the paper. A timing difference might be minor for the authors' main question and important for an essay about long-term change. Put that in your own words and flag it as your interpretation.
One paper can also have several outcomes. Some may point in different directions. If the results section describes the main outcome and a number of exploratory comparisons, identify which one supports the sentence you plan to cite. Do not let the most striking number replace the stated research question.
Use a one-page summary you can trace back to the paper
#Write your summary after seeing the result you need and tracing it to the method. A plain page is enough. Leave space for the places in the original that you will want to find again.
| Line in your summary | What to record |
|---|---|
| Record | Title, author, year and article version |
| Question | What the researchers wanted to find out |
| Method | Who or what they studied, what they compared, and how they measured it |
| Result | One finding with the units and the figure, table or page that supports it |
| Interpretation | What the authors think the result means, with your own interpretation labelled separately |
| Limit | The biggest issue that affects how you will use the finding |
| Next step | A term to learn, a source to read or a question to take to class |
For the invented plant study, the method line could name the two shelves, both light schedules and final height. The result line would give the two averages with centimetres and the figure reference. The limit line would mention the one-shelf-per-schedule arrangement. Someone looking at that page could see where the finding came from and why it should stay within that example.
When a passage is hard to understand, write down the term and where it appears. Read enough nearby text to see whether the paper defines it. A textbook, a glossary in the field or a librarian can help you work out the rest. If you use an AI tool under your institution's rules, check any explanation directly against the passage or a reputable reference. Keep confidential or restricted material out of tools you are not authorised to use.
Finish by putting the paper aside and saying its question, method, finding and main limit in plain language. If you cannot explain one piece, return to that part of the paper. Once your summary says where the evidence sits and what it allows you to say, you have something you can use for discussion, revision or the next source.