When home prices in a neighborhood climb 15% to 20% in a single year, real estate agents and local news headlines describe the market as "booming." Open houses turn into crowded block parties, properties sell within 48 hours for tens of thousands over the asking price, and prospective buyers are warned that if they do not purchase immediately, they will be permanently priced out of the housing market.
This psychological pressure is intense, but real estate does not operate on emotion; it operates on arithmetic. When the cost of housing detaches from the economic fundamentals that support it—specifically local wages, rental yields, and mortgage debt capacity—a market ceases to be healthy. It becomes overheated.
Buying a home at the peak of an overheated market carries severe financial consequences. If prices correct or stagnate, you risk falling into negative equity, where your mortgage balance exceeds the market value of your property. You become locked in place, unable to relocate for a job opportunity, refinance, or sell without bringing substantial cash to the closing table.
To protect your household wealth, you must look past market hysteria and evaluate objective data. Here are the five quantifiable warning signs that indicate a housing market is overheating, along with the math you need to evaluate your local area.
The Danger of Buying at the Peak: When Fear Overrules Math
#Housing bubbles and overheated markets are driven primarily by Fear Of Missing Out (FOMO). Buyers observe acquaintances making paper wealth on property, assume that real estate prices only move in one direction, and stretch their personal balance sheets to dangerous extremes.
In a balanced housing market, property values grow at roughly the rate of inflation plus local population and wage growth—typically 3% to 5% annually. In an overheated market, price growth accelerates into double digits while local salaries remain flat. 
Because homes are purchased using borrowed money, rising prices require ever-larger mortgages. When interest rates rise, mortgage payments escalate rapidly. If local household earnings cannot service that debt, the pool of qualified buyers shrinks. At that point, the market hits an affordability wall, and transaction volume grinds to a halt.
Warning Sign 1: The Price-to-Income Ratio Disconnect
#The single most dependable long-term barometer of real estate health is the Price-to-Income (P/I) ratio. It measures the relationship between median home prices and median household incomes in a given metropolitan area.
To calculate the Price-to-Income ratio for your target city or neighborhood:
- Step 1: Find the current median home sales price in your county or city.
- Step 2: Find the median annual household income for the same geographic area from official census or labor bureau records.
- Step 3: Divide the median home price by the median annual household income.
For example, if the median home price in a city is $450,000 and the median household income is $90,000, the Price-to-Income ratio is 5.0 ($450,000 / $90,000).
Historically, across stable developed real estate markets, a healthy and sustainable Price-to-Income ratio hovers between 3.0 and 4.0. At a 3.5 multiple, a family earning median wages can comfortably afford standard mortgage underwriting guidelines without sacrificing retirement savings, maintenance funds, or everyday essentials.
In superstar coastal cities, supply constraints naturally push this multiple higher. However, when a secondary city or suburban market suddenly leaps from a historical ratio of 4.0 up to 7.0, 8.0, or 10.0 without a massive influx of high-paying corporate headquarters, the market has detached from reality. When local workers cannot afford to buy local homes, the market is running on speculative borrowed time.
Warning Sign 2: The Price-to-Rent Ratio Crosses the Danger Threshold
#The Price-to-Rent (P/R) ratio functions in real estate much like the Price-to-Earnings (P/E) ratio functions in the stock market. It tells you whether asset prices are supported by underlying cash flow.
To calculate the Price-to-Rent ratio:
- Step 1: Identify the purchase price of a typical home.
- Step 2: Determine what an equivalent home rents for annually (monthly rent multiplied by 12).
- Step 3: Divide the purchase price by the annual rent.
For example, if a townhouse costs $500,000 to buy and an identical unit in the same complex rents for $2,000 per month ($24,000 per year), the Price-to-Rent ratio is 20.8 ($500,000 / $24,000).
Economists benchmark the Price-to-Rent ratio into three distinct zones:
- 1 to 15 (Favorable to Buy): The cost of purchasing is low relative to prevailing rents. Rental yields are strong, and ownership provides solid financial value.
- 16 to 20 (Balanced Zone): The decision between buying and renting depends on individual factors like length of stay, down payment size, and local property taxes.
- 21 and Above (Severely Overheated / Favorable to Rent): The market is drastically overvalued relative to rental utility. Purchasing costs far outstrip the cost of renting an equivalent living space.
When the Price-to-Rent ratio exceeds 21, speculative investors are buying properties with negative cash flows, gambling purely on future price appreciation to bail them out. When yields compress this severely, renting is mathematically superior, allowing households to preserve capital and build liquid savings while avoiding inflated ownership overhead.
Warning Sign 3: Mortgage Payments Far Exceed Local Rents
#A healthy housing market maintains parity between the monthly cost of owning and the monthly cost of renting. While homeownership carries tax advantages and principal paydown, it also incurs property taxes, homeowners insurance, maintenance costs (typically 1% to 2% of the home value annually), and HOA fees.
In an overheated market, a massive financial chasm opens between monthly rent and monthly ownership costs. 
Calculate the total monthly cost to own a target property, including principal, interest, property taxes, home insurance, and maintenance reserves. Compare that number directly against the market rent for an identical home on the same street.
If the monthly cost to buy the property is 40% to 70% higher than the monthly cost to rent it, the market is severely inverted. 
Consider this scenario: renting a three-bedroom home costs $2,200 per month, while purchasing that same home with 10% down requires a total monthly outlay of $3,600. A buyer is paying a $1,400 monthly premium purely for the privilege of ownership. 
Historically, massive ownership premiums cannot sustain themselves over extended periods. Eventually, rational buyers step back, rental vacancies rise, and property prices must decline or plateau for years until wages and rents catch up.
Warning Sign 4: Speculative Investor Activity and Rapid Flipping
#When owner-occupants dominate a housing market, buying decisions are anchored to long-term life plans: schools, commute times, family stability, and career moves. Owner-occupants do not panic-sell when prices dip 5%; they continue living in their homes.
In an overheated market, institutional private equity funds, retail speculators, and casual flippers flood the market. 
Warning signs of speculative market distortion include:
- Investor purchase share exceeding 25% of all transactions: When one out of every four properties in a metro area is bought by an entity that does not intend to live in it, the market loses organic stability.
- Rapid cosmetic flips: Homes purchased, painted with trendy neutral colors, fitted with cheap laminate flooring, and relisted 90 days later for a $100,000 markup indicate a speculative trading environment rather than fundamental value creation.
- Short-term rental saturation: Entire suburban subdivisions being purchased to operate as unlicensed vacation rentals artificially restricts long-term housing supply and inflates prices.
Speculative capital is fickle. The moment interest rates rise, rental occupancy softens, or alternative assets (like government bonds) offer safer returns, investors stop buying and begin dumping inventory simultaneously, triggering sharp localized price drops.
Warning Sign 5: Desperation Behaviors (Waiving Inspections and Appraisals)
#The final and most dangerous sign of an overheated market is behavioral: buyers abandoning standard risk management protections in a state of manufactured panic.
During balanced market conditions, purchase contracts include essential protective clauses:
- Home inspection contingency: Allows the buyer to hire an independent licensed inspector to evaluate the roof, foundation, plumbing, electrical panel, and HVAC systems. If catastrophic defects are discovered, the buyer can demand repairs, request price credits, or terminate the contract with their earnest money deposit fully refunded.
- Appraisal contingency: Ensures that if an independent bank appraiser values the property below the agreed contract price, the buyer does not have to cover the shortfall out of pocket.
- Financing contingency: Protects the buyer if unexpected mortgage underwriting hurdles arise before closing.
In an overheated frenzy, sellers demand that buyers waive all contingencies. Bidding wars compel desperate buyers to sign contracts promising to buy homes "as-is" without inspections and guaranteeing to cover unlimited appraisal gaps with cash.
Waiving a home inspection on a thirty-year-old home to beat out four other bidders is gambling, not investing. A hidden cracked foundation or failing sewer line can easily cost $30,000 to $60,000 to remediate within six months of moving in, instantly wiping out a buyer's liquid reserves.
| Indicator | Healthy / Balanced Market | Overheated / Bubble Territory | What It Means for You |
|---|---|---|---|
| Price-to-Income Ratio | 3.0 to 4.0 | 6.5 to 9.0+ | Homes are mathematically unaffordable for local wage earners |
| Price-to-Rent Ratio | 12 to 18 | 22 to 30+ | Renting is significantly cheaper than buying equivalent shelter |
| Ownership vs Rent Gap | Ownership within 10% to 20% of rent | Ownership exceeds rent by 40% to 70%+ | Large monthly ownership penalty; high risk of price correction |
| Investor Activity | 10% to 15% of transactions | 25% to 35%+ of transactions | Market dominated by fickle speculative capital, not families |
| Buyer Contract Terms | Full inspection and appraisal contingencies | Widespread contingency waivers and appraisal gaps | Buyers taking on extreme legal and structural liabilities |
| Days on Market (DOM) | 45 to 75 days | Under 7 days; immediate blind bidding | Manufactured urgency overriding careful financial analysis |
What to Do If Your Local Market Is Overheated: 4 Smart Moves
#Discovering that your target real estate market exhibits multiple overheating warning signs does not mean you are powerless. It simply means you must abandon emotional urgency and adopt a disciplined financial posture.
1. Rent Defensively and Bank the Difference
#If your local Price-to-Rent ratio is above 21 and the monthly cost of owning is 50% higher than renting, do not view renting as "throwing money away." Renting provides a fixed housing cost with zero capital expenditure liability. 
Rent a comfortable, modest home and aggressively invest the monthly savings—the difference between the high cost of ownership and your lower rent—into high-yield savings accounts, index funds, or short-term treasury bills. When the housing market eventually cools, you will have a significantly larger cash cushion and superior negotiating leverage.
2. Never Waive Essential Due Diligence
#No matter how competitive a bidding situation appears, never waive your home inspection contingency. If a seller refuses to accept an offer that includes a basic structural and mechanical inspection, walk away. There is always another property.
If you must make your offer more competitive, offer a short inspection window (such as 5 business days instead of 10) or agree not to request minor cosmetic repairs under $1,500, while explicitly reserving the right to void the contract if major structural, environmental, or mechanical failures are discovered.
3. Stress-Test Your Monthly Housing Budget
#If you decide to purchase in an elevated market for personal reasons, ensure your monthly payment is completely resilient. 
- Keep your total housing payment (principal, interest, property taxes, homeowners insurance, and HOA fees) under 28% to 30% of your gross monthly household income.
- Insist on a 30-year fixed-rate mortgage. Never take on adjustable-rate mortgages (ARMs) or balloon products in an overheated market in the hope that interest rates will drop later.
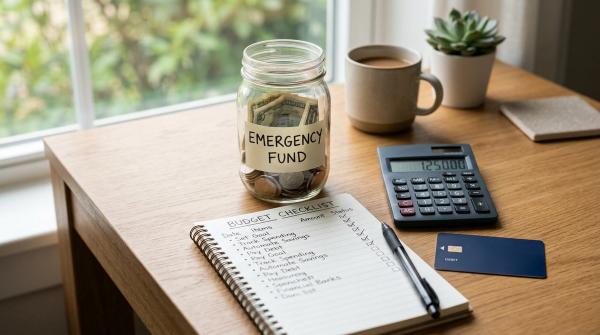
- Preserve an emergency fund of at least six months of living expenses in liquid cash after paying your down payment and closing costs.
4. Lengthen Your Investment Horizon
#Real estate cycles typically run between seven and ten years. If you buy at an elevated price point, you must be prepared to hold the property for a minimum of 10 to 15 years. Over a fifteen-year horizon, wage growth and inflation will eventually absorb temporary market pullbacks. 
If there is any realistic chance you will need to relocate, change careers, or sell the property within the next three to five years, buying in an overheated market is an unacceptable gamble.
The Bottom Line
#A home is where you live, raise a family, and build memories, but it is also the largest financial asset on your balance sheet. Do not let real estate marketing or peer pressure convince you to abandon basic mathematical discipline.
When the Price-to-Income and Price-to-Rent ratios flash red, when investors outnumber families, and when buyers waive basic protections in bidding frenzies, step back. Patience in an overheated market is not missed opportunity; it is capital preservation.